
Overview
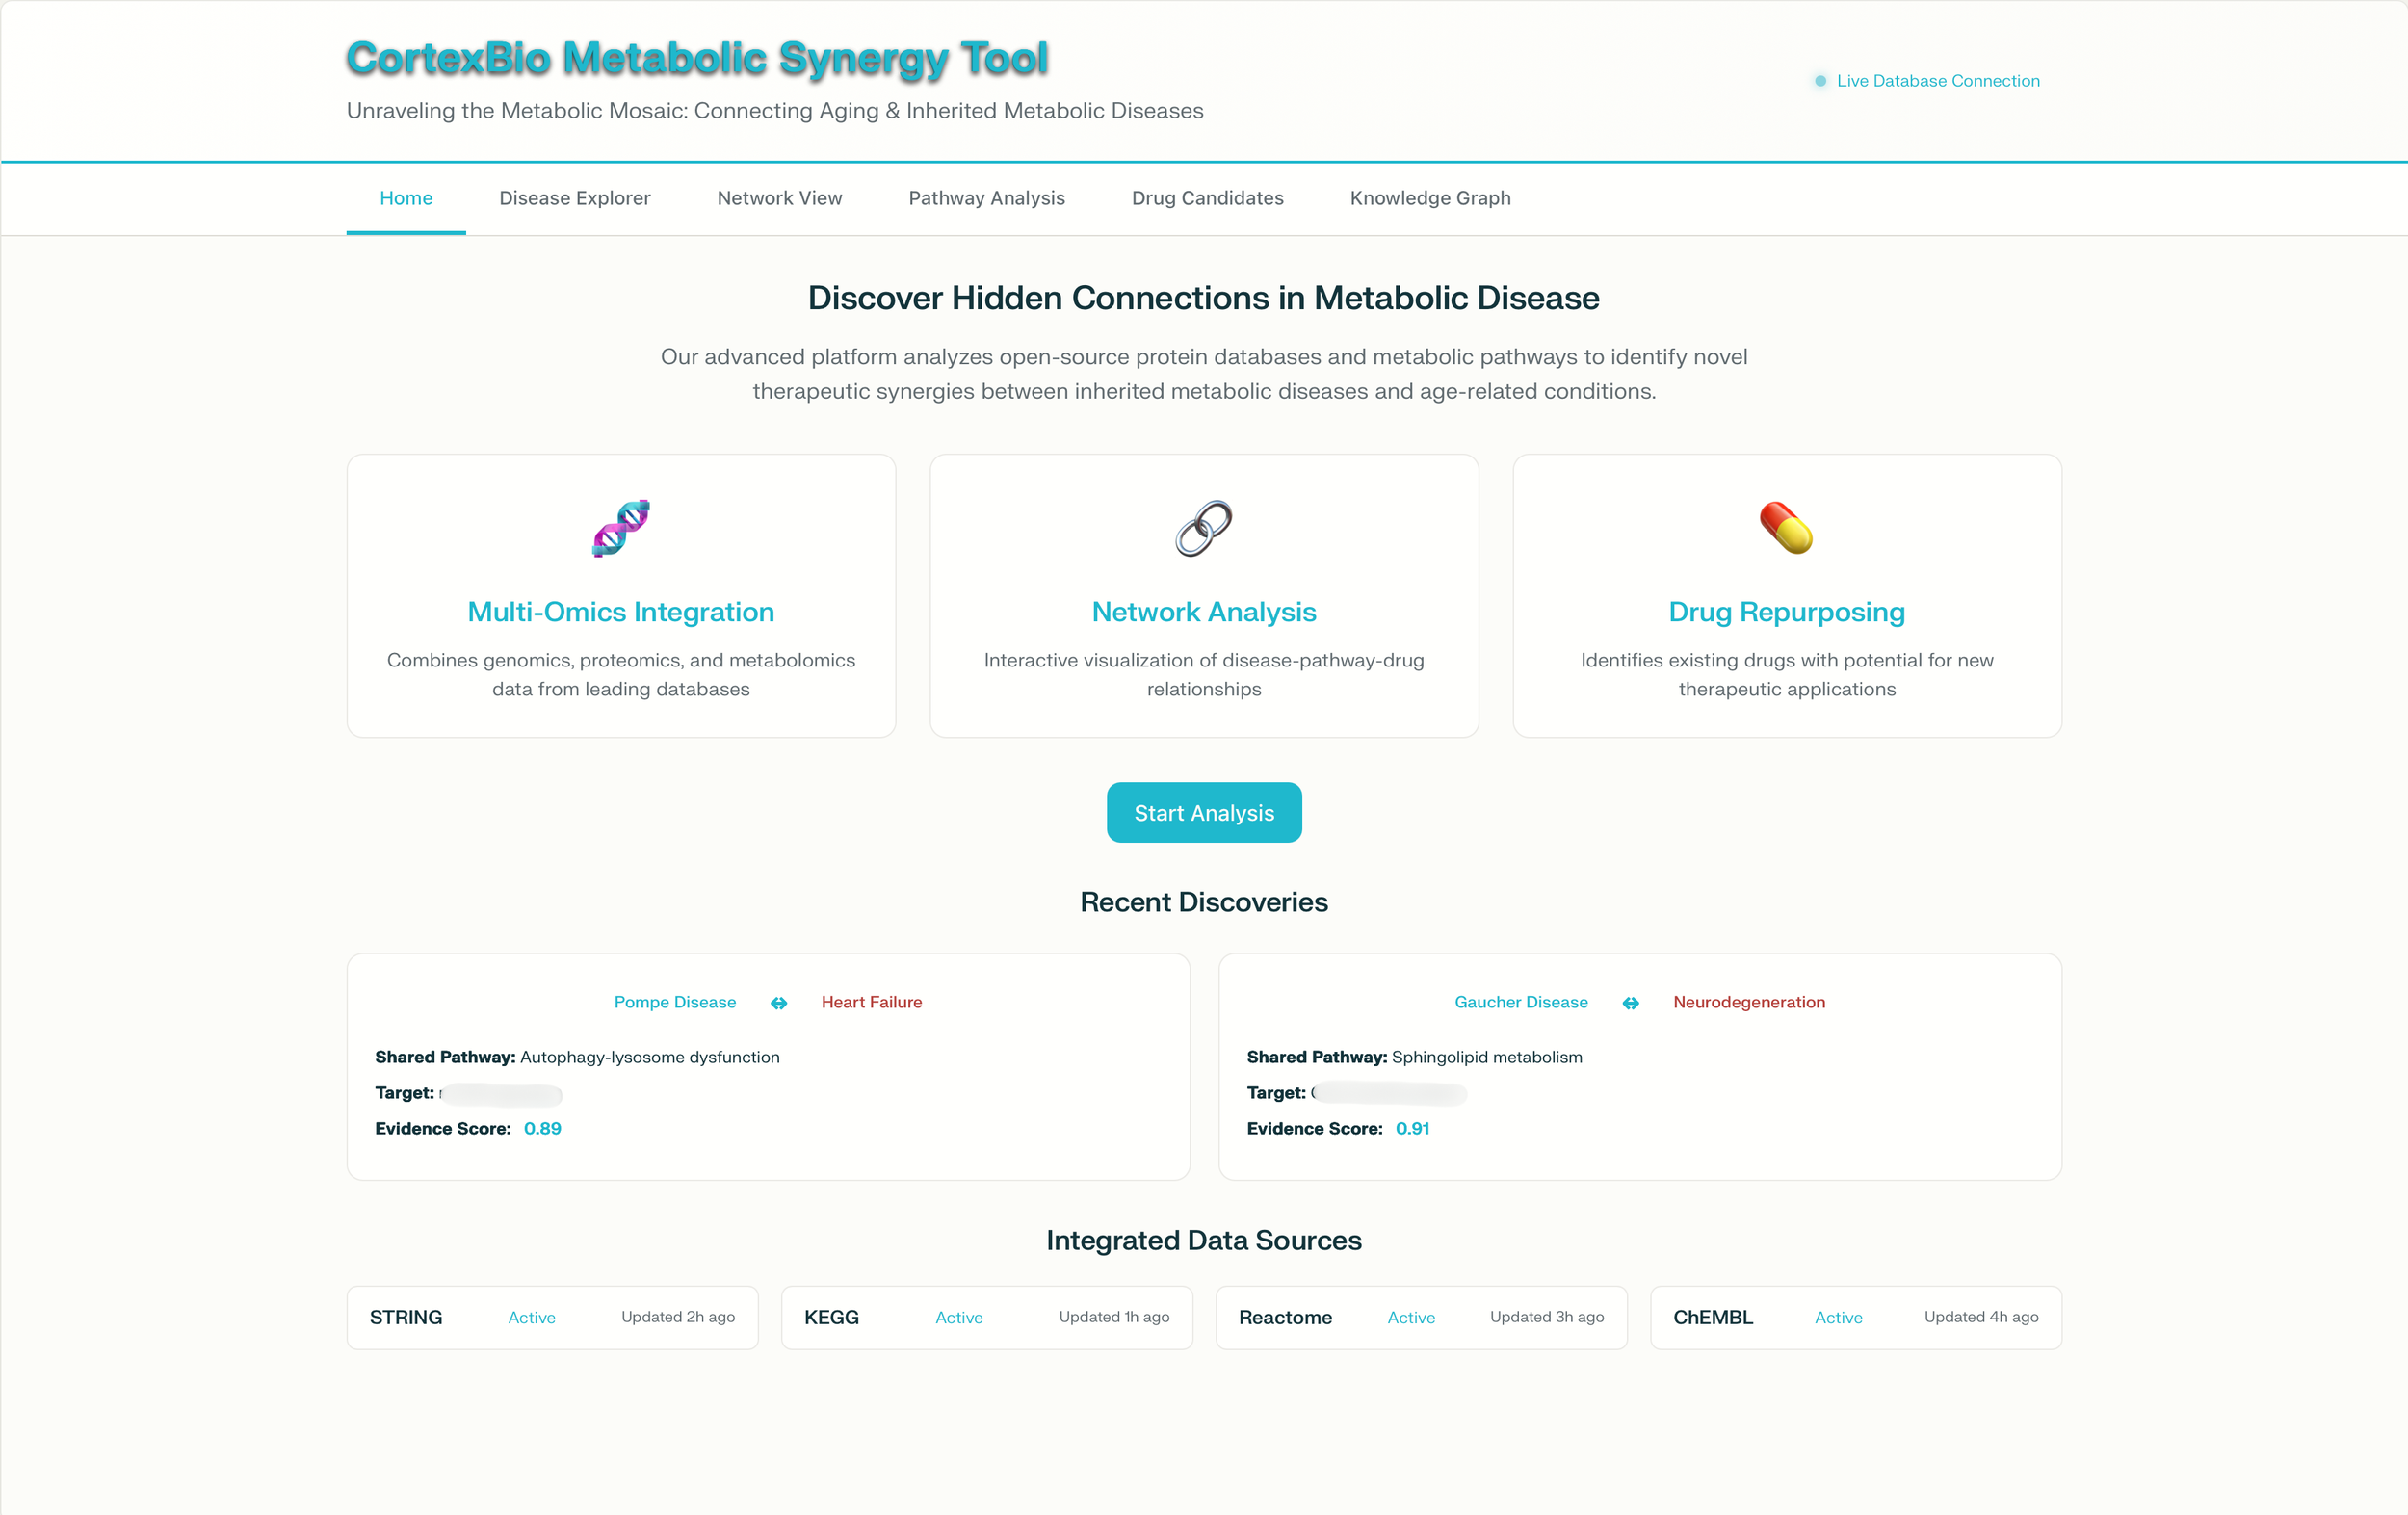
The Metabolic Synergy Tool© is still under development but sufficiently advanced to show some images of the Dashboard and real output results. We would like to share some understanding on how the Tool works whilst describing the typical features that would be expected in an advanced metabolic synergy analysis platform.
Key Dashboard Components
Based on industry standards the Metabolic Synergy Tool© dashboard includes several integrated visualisation panels
Real-Time Metabolic Pathway Visualisation
The dashboard displays interactive metabolic pathway networks showing the relationships between different metabolites, enzymes, and reactions[1][2][3]. These pathways are colour-coded to indicate activity levels, with the ability to zoom in and out for detailed examination of specific metabolic subsystems.
Multi-Dimensional Data Analysis Panels
Modern metabolic analysis tools incorporate multiple data views including heat maps for metabolite abundance, time-series graphs for kinetic data, and scatter plots for correlation analysis[1][4][5]. The dashboard allows simultaneous visualisation of these different data types to provide comprehensive metabolic insights.
Synergy Score Calculations
Similar to drug combination synergy tools, the metabolic synergy dashboard displays synergy scores using various mathematical models[6][7][8]. These scores help identify metabolic interactions that produce enhanced or diminished effects when multiple pathways are active simultaneously.
Interactive Features
The dashboard includes search functionality to quickly locate specific metabolites, pathways or reactions within the network[2][3][9]. Users will be able to click on individual nodes to access detailed information, view associated experimental data and explore connected metabolic processes.
Data Integration Capabilities
A comprehensive Tool supports integration of multiple data types including transcriptomics, proteomics, and metabolomics data[1][10][11]. This multi-omics approach allows for a more complete understanding of metabolic regulation and cellular responses.
Customisable Analysis Workflows
The Tool will offer flexibility in data analysis with options to apply different statistical methods, adjust visualisation parameters, and create custom analysis pipelines[4][5][12]. Users could save and share their analysis configurations for reproducible research.
The Metabolic Synergy Tool© as a live synergy platform will distinguish itself through its real-time analysis capabilities and proprietary algorithms for detecting metabolic synergies that may not be apparent through traditional analysis methods.
References:
1. https://www.orpha.net/pdfs/orphacom/cahiers/docs/GB/Prevalence_of_rare_diseases_by_alphabetical_list.pdf
2. https://www.genenames.org/help/search/
3. https://www.orpha.net/pdfs/data/patho/Pro/fr/HypogonadismeHypogonadotropeCongenital-FRfrPro17985.pdf
4. https://www.orpha.net/de/research-trials/research-projects/534056?terminated=0
5. https://www.orpha.net/pdfs/data/patho/Pro/fr/CancerPapillaireFolliculaireThyroide-FRfrPro905v01.pdf
6. https://www.orpha.net/pdfs/data/patho/Emg/Int/fr/InsuffisanceSurrenalienneAigue_FR_fr_EMG_ORPHA95409.pdf
7. https://www.orpha.net/pdfs/data/patho/Emg/de/Emergency_HemiplegischeMigraene--dePro1031.pdf
8. https://www.genenames.org/help/multi-symbol-checker/
9. https://www.genenames.org/useful/instructions-to-authors/
10. https://www.genenames.org/help/hcop/
11. https://www.genenames.org/help/request-symbol/
12. https://www.genenames.org/about/old-guidelines/